Monitoring CPU temperature is one of those basic yet essential habits every PC owner should cultivate—whether you’re a casual user, a gamer, or a tinkerer.
To check the CPU temperature, open the BIOS during startup or use free tools like Core Temp, NZXT CAM, or SpeedFan. On Linux, use htop. These methods quickly show your PC’s CPU temperature in real-time.
This guide delves into how to check your CPU temperature, why it’s important, what safe ranges look like, and what to do if things are running too hot.
Why You Should Check Your CPU Temperature
- Performance Stability & Troubleshooting
High temperatures can cause sluggish performance, accidental shutdowns, and even system instability. Monitoring temps helps diagnose these issues before they escalate. - Overclocking Safeguard
If you’re pushing your hardware beyond stock specs—especially through overclocking—keeping an eye on temp ensures you’re not crossing into unsafe territory. - Preventive Maintenance
Temperature trends can signal hardware degradation or dust buildup. Checking temps periodically is akin to keeping tabs on a car’s oil levels.
Ways to Check CPU Temperature
A. Using BIOS or UEFI Firmware Settings
Before Windows loads, you can check idle CPU temps straight from your BIOS or UEFI. Restart your PC and press Delete, F2, or the key prompt during boot. Look in sections like “Hardware Monitor,” “PC Health Status,” or “System Status.”
Note: This only reflects idle temperatures—real-world load temps are usually higher.
B. Third-Party Software Tools (Windows & Others)
Since Windows lacks native temp monitors, you’ll need external utilities:
- Core Temp – A lightweight application that displays real-time per-core temperatures in a clean interface. Be cautious during installation to avoid bundled extras.
- NZXT CAM – Sleek and modern, it packs CPU, GPU, performance, and in-game overlays all in one.
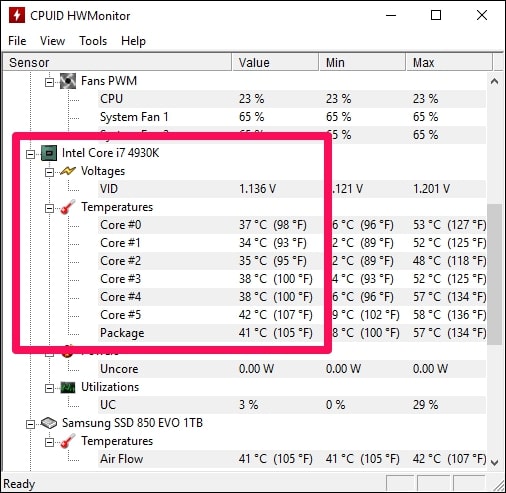
- HWInfo – Deep hardware diagnostics with customizable sensor views.
- Open Hardware Monitor – Open-source, free, and displays critical metrics like temps, voltages, fan speeds.
- SpeedFan – A powerful, free tool that not only reads temperatures but also adjusts fan speeds. More complex setup.
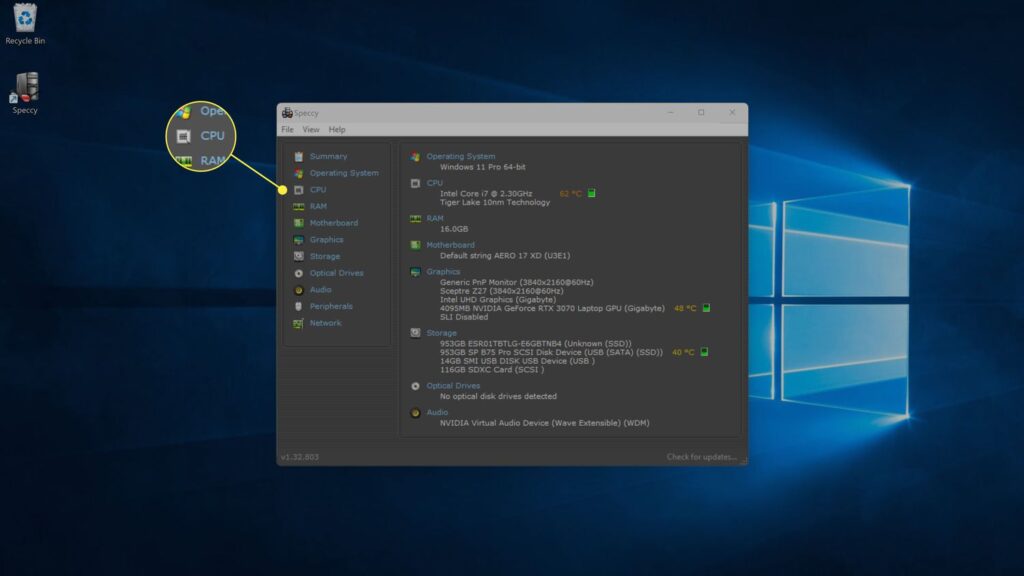
- Speccy – A simpler, user-friendly tool for viewing temperatures and system details.
- Vendor-specific tools, such as Intel XTU, AMD Ryzen Master, Corsair iCUE, and MSI Afterburner, often include temperature readings.
C. In-Game Monitoring with Steam (Windows & Linux)
A recent Steam beta now supports CPU temperature display via the Performance Monitor overlay.
On Windows, this requires enabling a kernel-mode driver—originating from the CPUID SDK. The feature can be disabled if you’re concerned.
D. External Hardware Options (Rare Alternative)
Some advanced cooling solutions—like AIO pumps—offer built-in LCDs or dashboards with real-time temp data, bypassing software entirely.
3. What’s a Safe CPU Temperature?
How “safe” ranges depend on usage, device type (desktop vs. laptop), and CPU generation:
| Usage Scenario | Safe Temperature Range |
| Idle/Desktop | < 50–60 °C (≈122–140 °F) |
| Moderate Load (browsing, streaming) | 60–70 °C – still acceptable |
| Heavy Load (gaming, rendering) | Up to 80 °C – near upper comfort zone |
| High-end CPUs or Laptops | Some CPUs (e.g., Ryzen 5000/7000 or Intel i9 12–14 gen) can safely hit 95–100 °C under load |
| Danger Zone | Sustained temps above 95 °C may cause throttling; 100+ °C risks shutdown |
| Thermal Throttling Threshold | Around 100 °C (212 °F) on many processors |
What Reddit Users Say
Getting insights from the trenches:
- “Windows 11 doesn’t have that built in. Go for the CoreTemp … Simple, low weight app that does only what u asked.”
— u/RubbaNoze - “Use hardware health monitoring software… popular ones are hwmonitor, hwinfo, and openhardware monitor (make sure you enable logging).”
— u/OkMany3232 - “SpeedFan is a program that monitors voltages, fan speeds and temperatures…”
— derived from technical discussion on Superuser
Step-by-Step: Checking Your CPU Temperature (Windows)
Step 1: Pick Your Method
- BIOS: Reboot, press the BIOS key, navigate to hardware monitoring.
- Software: Download a tool like Core Temp or HWInfo. Watch for install checkboxes.
Step 2: Run and Read
- Core Temp: Shows real-time per-core and overall average temps.
- HWInfo / Open Hardware Monitor: Locate CPU temp sensors and review readings.
Step 3: Monitor Under Load
- Keep the monitoring tool open while gaming, rendering, or using a stress test like Prime95 to see peak temperatures.
Step 4: Cross-Reference Specs
- Compare with your CPU’s “TJ Max” or manufacturer-stated thermal specs to determine thresholds.
Step 5: Respond If Too Hot
If temperatures are consistently above desired levels:
- Clean Thoroughly – Remove dust from heatsinks, fans, filters.
- Ensure Proper Fan Function – Check all fans are spinning and oriented correctly for airflow.
- Reapply Thermal Paste – Especially if it’s old (typically every few years).
- Upgrade Cooling – Consider better air coolers or water cooling.
- Optimize Case Airflow – Use positive air pressure, tidy cables, add intake/exhaust fans.
- Undervolt or Dial Back Overclock – Reducing voltage can cut heat significantly with minimal performance loss.
Advanced Tips
- Logging & Alerts: Tools like HWInfo can log temps over time and send alerts if thresholds are exceeded.
- In-Game Monitoring: Steam’s overlay now supports CPU temps—just be aware of the kernel-level driver involved.
Summary Table
| Method / Tool | Platform | What It Does | Pros | Cons / Notes |
| BIOS / UEFI | Windows / pre-OS | Idle temperature read | No software needed | No load data, manual navigation |
| Core Temp | Windows | Per-core temp, simple UI | Lightweight, focused | Watch install popups |
| NZXT CAM | Windows | CPU + GPU stats, overlays | Stylish, versatile | Overkill if just temp monitoring |
| HWInfo / Open Hardware Monitor | Windows | Deep sensor insights | Detailed, customizable | Interface may feel complex |
| SpeedFan | Windows | Temp + fan control | Powerful, free | Complex to configure, intimidating UI |
| Speccy | Windows | Overview temps | Easy to use | Less detailed than other tools |
| Vendor Tools (XTU, Ryzen Master) | Windows | CPU-package-specific stats | Direct from manufacturer | Limited to specific hardware |
| Steam Performance Overlay (Beta) | Windows/Linux | In-game temp overlay | Convenient for gamers | Requires beta, driver, security consideration |
| AIO/LCD-equipped Cooling | External hardware | Real-time hardware display | Installer-free monitoring | Only with compatible hardware |
How to check CPU temp Windows 11
Windows 11 doesn’t show CPU temp directly, but you can check it using free apps like Core Temp, HWInfo, or NZXT CAM. Just download, install, and run the software to view your CPU’s live temperature safely.
How to check CPU temp Windows 10
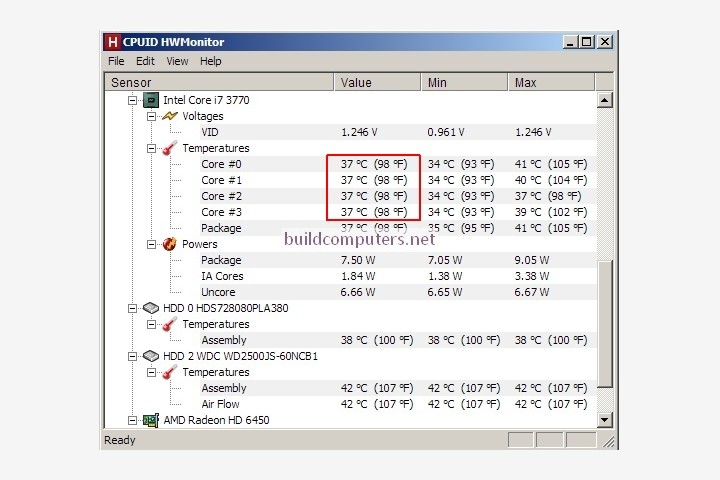
Windows 10 also lacks built-in CPU temp monitoring. Use tools like Core Temp or HWMonitor to see temperatures in real time.
Simply download, open the app, and you’ll get per-core readings for your processor’s heat levels instantly.
How to check CPU temp on laptop
Laptop CPUs heat up faster due to compact design. To check temperature, install utilities like Speccy, HWInfo, or Core Temp.
These apps show real-time readings, helping you prevent overheating and maintain smooth laptop performance during daily tasks.
How to check CPU temperature Task Manager
Unfortunately, Windows Task Manager doesn’t display CPU temperature. It only shows usage percentages.
To see heat levels, you need third-party software like Core Temp, SpeedFan, or HWInfo, which provide accurate live readings of your processor temperature.
How to check CPU temp in BIOS
Restart your PC and press the BIOS key (often F2 or Delete). Inside BIOS, look for “Hardware Monitor” or “System Health.” This section displays your CPU’s current idle temperature before Windows loads.
FAQs
1. How do I check my CPU temperature Windows 10?
Windows 10 doesn’t show CPU temp directly. Use free tools like Core Temp, HWInfo, or Speccy to see real-time heat levels safely.
2. How do I check CPU temperature in Task Manager?
Task Manager can’t show CPU temperature. Instead, download lightweight software such as Core Temp or HWMonitor, which provide accurate and live readings of your processor’s heat levels.
3. How do I show my CPU temperature?
You can show CPU temperature by installing Core Temp or HWInfo. Some apps even let you display the readings directly in the taskbar for quick access.
4. How do I check my CPU heat level?
To check CPU heat, use free monitoring tools like HWMonitor, NZXT CAM, or Core Temp. These apps show live temperature readings and alert you to overheating.
5. How do I show my CPU temperature in Windows 10 taskbar?
Install Core Temp and enable the “Show in Notification Area” option. This lets your CPU temperature appear directly on the Windows 10 taskbar for easy monitoring.
6. Can CPU Z check temperature?
CPU-Z shows detailed processor information but does not display temperature. For accurate heat monitoring, use HWMonitor or Core Temp, which are made for tracking CPU temperatures.
7. How hot is too hot for a CPU?
Most CPUs run safely under 80°C. Consistently above 90°C is risky and may cause throttling. Reaching 100°C or more is considered dangerously hot.
8. How do I see my CPU?
You can see your CPU details in Task Manager under the Performance tab. For deeper information and temps, use apps like CPU-Z or HWInfo.
9. What are signs of CPU overheating?
Signs include sudden shutdowns, loud fan noise, freezing, laggy performance, or error messages. Checking CPU temperature with Core Temp can confirm if overheating is the problem.
10. How to check CPU temperature on Nvidia?
Nvidia’s GeForce Experience shows GPU temps, not CPU. To check CPU temperature, install Core Temp, HWInfo, or NZXT CAM, which track your processor’s heat levels.
Final Thoughts
Checking your CPU temperature is not just about avoiding a meltdown—it’s about keeping your system healthy, responsive, and long-lived. Whether you use BIOS, a lightweight app, or gaming overlays, the key is awareness. Make it a habit to monitor temperatures periodically, especially during heavy use or overclocking. And if the numbers rise—don’t panic; troubleshoot calmly with the steps outlined above.
Let me know if you’d like help choosing the best tool for your system, walkthroughs for specific software, or deeper guidance on thermal solutions or optimizations!